
Content analytics: what your stories achieve
Under Analytics you see how viewers use your stories. The figures come from the player itself, without third-party cookies and without names. The page has three tabs: Content, Advertising and Votes.
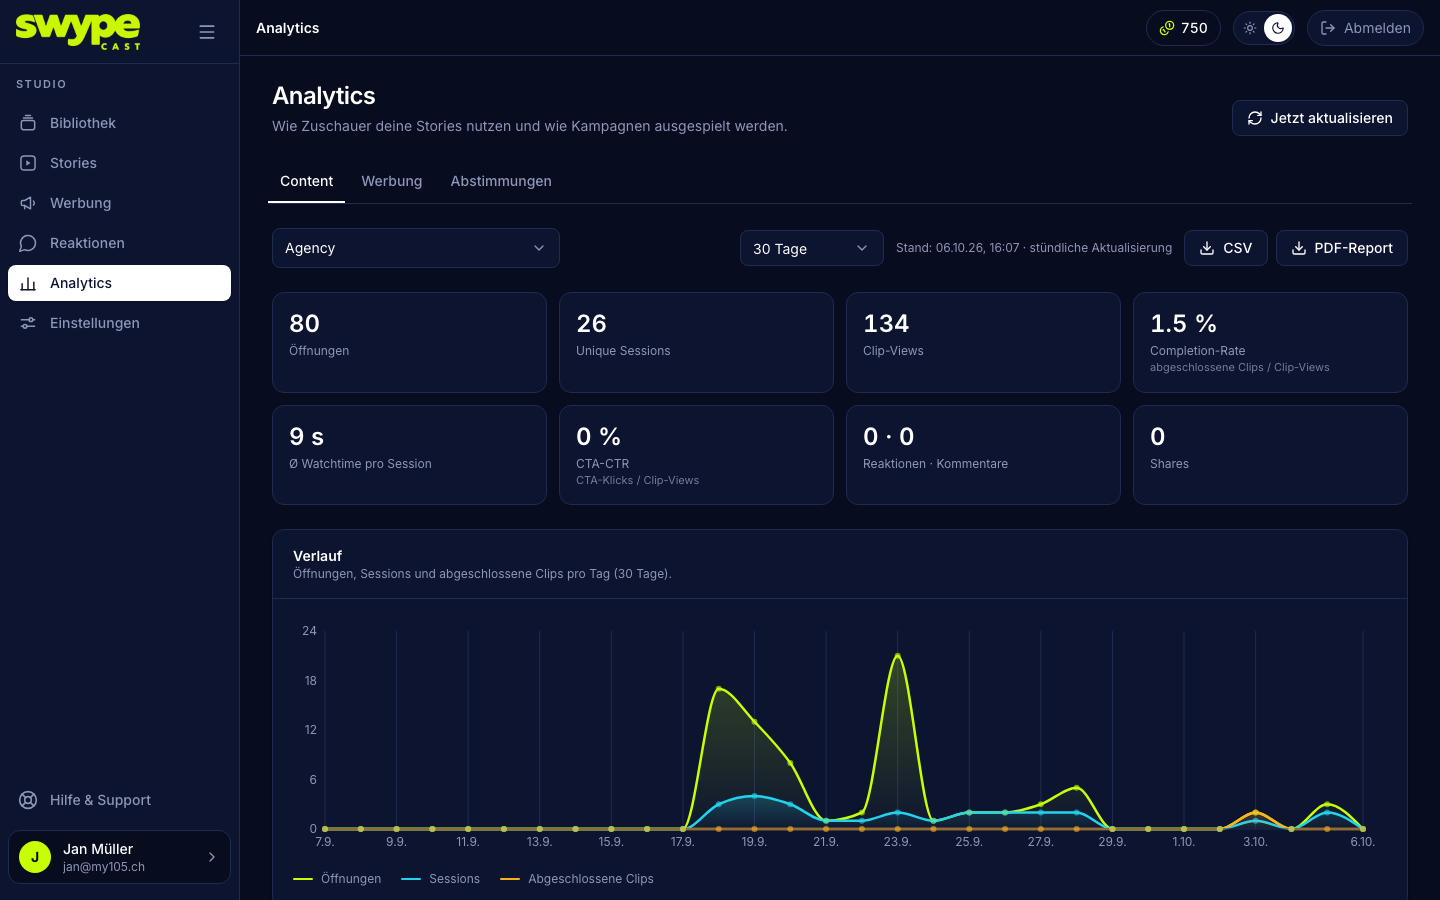
Choose story and period
- Choose the story at the top left. The search field helps if you have many.
- Choose 7, 30 or 90 days or your own range (From and To).
All figures and charts refer to this story and this period.
The key figures
- Opens: how often the story was started.
- Unique sessions: how many different viewers that was (counted by an anonymous ID per browser).
- Clip views: how many clips were watched in total.
- Completion rate: the share of clip views that ran to the end.
- Avg. watch time per session: how long a person stays on average.
- CTA CTR: how often a button in a clip was clicked, relative to clip views.
- Reactions · Comments and Shares.
Trend and drop-off
- Trend shows opens, sessions and completed clips per day.
- Drop-off shows how many viewers (relative to the first clip) still see each clip. A sharp drop after clip 3 means: clip 3 or 4 loses people. Shorten, reorder or swap.
Per clip
The table Per clip shows views, completion, avg. watch time, CTA CTR, reactions, comments and exits for every clip. That is how you find your best clips.
Sources, devices, countries
At the end you see which websites viewers came from (Traffic sources), which devices and operating systems they used and which countries they are in.
Export and refresh
- CSV downloads the figures for Excel or Numbers, PDF report as a document to pass on.
- The figures are aggregated every hour; the time of the last update is shown next to the period. Refresh now at the top right fetches the latest state (at most every two minutes).
Was this helpful?